Face-to-face socializing appeared less often in Americans’ time diaries in 2025 than it had a decade earlier. On an average day, 30.4 percent of people age 15 or older engaged in what the Bureau of Labor Statistics classifies as “socializing and communicating,” down from 38.1 percent in 2015.
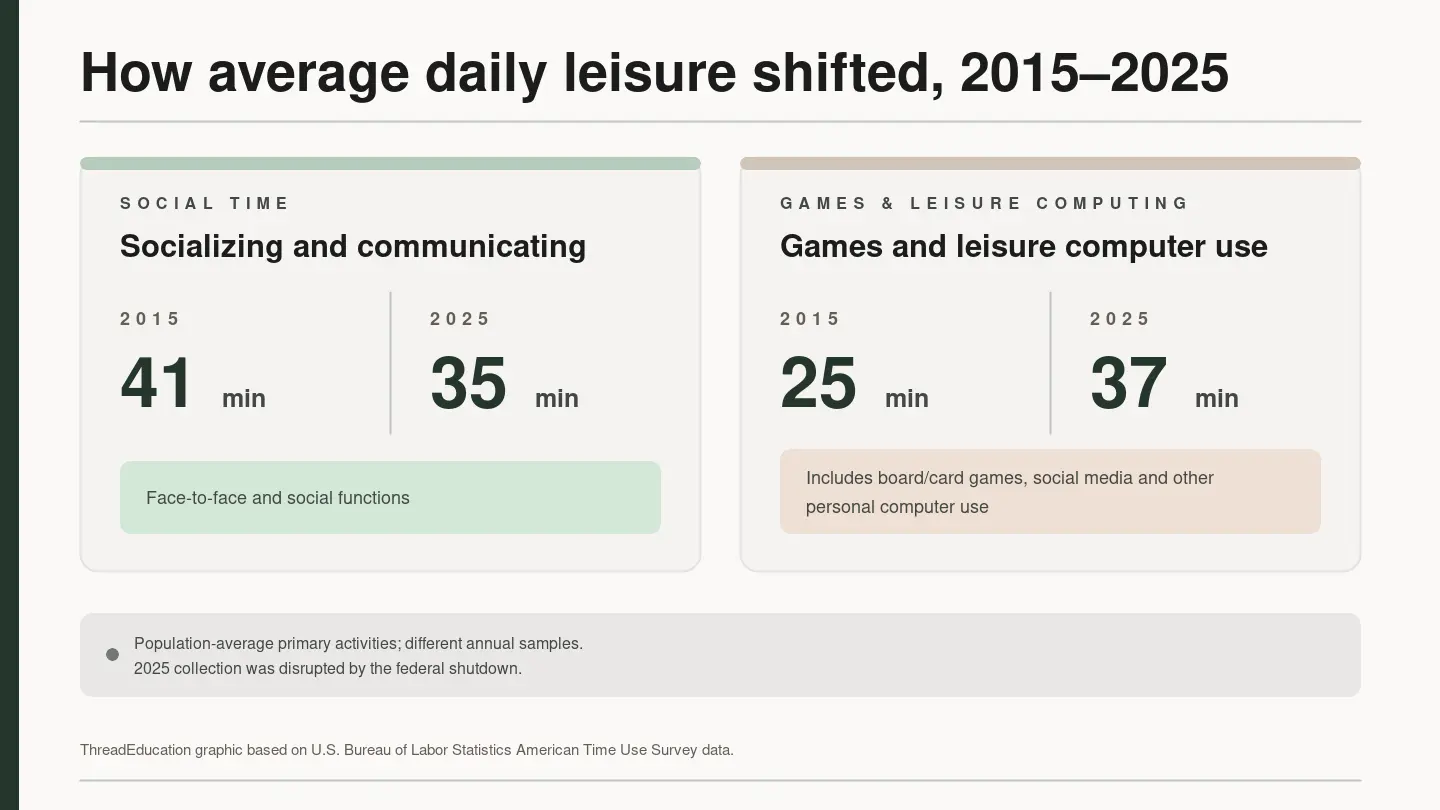
Over the same decade, population-average time spent playing games or using a computer for leisure rose from 25 minutes to 37 minutes a day. The two directions make an intuitive pair, but the American Time Use Survey does not show that one activity displaced the other. It records separate estimates from different annual samples, not the digital migration of a fixed group of people.
The categories are narrower and more technical than their everyday labels suggest. Socializing means face-to-face interaction and social functions, not all contact with other people. Games and leisure computer use includes more than video games, but it is not total screen time. Understanding those boundaries is essential to understanding what changed.
Socializing appeared on fewer average days
The participation rate is the clearest measure of how the socializing pattern shifted. In 2015, 38.1 percent of people reported socializing and communicating on an average day. In 2025, 30.4 percent did.
The population-average time estimate moved in the same direction. It was 0.68 hours, or 40.8 minutes, in 2015 and 0.58 hours, or 34.8 minutes, in 2025. BLS rounded those figures to 41 and 35 minutes in its decade summary. Population averages include everyone in the represented population, including people who did not report the activity on their diary day.
The result looks different when the denominator is limited to participants. Among people who did socialize on the diary day, the average was 1.78 hours in 2015 and 1.92 hours in 2025. The decline in the population mean therefore combines a lower participation rate with a different amount of time among participants. It does not support the simpler claim that everyone who socialized spent less time doing it.
BLS uses a specific definition of “socializing and communicating”: face-to-face communication and hosting or attending social functions. Texting, email, telephone calls, and internet voice or video calls are assigned to a separate category. The 30.4 percent figure therefore does not measure all communication, all time with other people, loneliness or social isolation.
Leisure games and computer use occupied more average time
In the other direction, population-average time classified as playing games or using a computer for leisure rose from 25 minutes in 2015 to 37 minutes in 2025. The 2025 table gives the underlying estimate as 0.62 hours per day.
That category includes board games, card games, computer and video games, social media, and other computer or internet activity pursued for personal interest. It is broader than gaming alone. At the same time, it is narrower than total computer, internet, smartphone or screen use because ATUS codes computer-mediated activities according to their purpose. Online shopping, homework, banking and correspondence are classified elsewhere.
The age tables show how strongly this category can vary across the population. For ages 15–19, the 2025 population-average estimate was 1.53 hours per day. That number is an average for the age group, including those who did not report the activity as their primary activity during the diary day. It should not be read as a typical gaming session or as a measure of addiction.
Nor should the rise in this leisure category be offered as the explanation for the decline in face-to-face socializing. The survey did not test a causal link between the series. Their definitions also leave out simultaneous activity: someone could exchange messages, use social media or interact face to face while another activity remained the main one recorded in the diary.
A diary measures the main activity, not everything happening at once
For the American Time Use Survey, the Census Bureau interviews one randomly selected person age 15 or older from a household that completed the Current Population Survey. In a telephone interview, that person reconstructs the previous day from 4 a.m. to 4 a.m. The survey weights restore weekdays and weekends to roughly five-sevenths and two-sevenths of the annual estimate and make the results nationally representative of the civilian noninstitutional population age 15 or older.
In general, ATUS records only the respondent’s primary activity. When two activities overlap, the respondent identifies the main one. If no main activity can be identified, the first activity mentioned is recorded. Secondary childcare is the routinely collected exception.
That method creates a consistent accounting system, but it cannot capture the full duration of activities frequently done in the background. A video call during meal preparation, social media during television viewing or a game played alongside another reported activity may not appear as primary time in its category. The figures describe classified primary activities, not total exposure to social contact, games or digital media.
Two national snapshots, with different sample sizes
About 6,100 people were interviewed for the 2025 estimates, compared with about 10,900 in 2015. Each respondent supplied one diary. The decade comparison therefore contrasts two weighted cross-sections; it does not follow the same individuals for ten years or show how any one person’s day changed.
The BLS release describes the decade results as less socializing and more games or leisure computer use. It does not, however, publish comparison tests for these three changes or explicitly label them statistically significant. BLS generally evaluates estimates at a 90 percent confidence level, but an estimate being eligible for publication does not by itself establish that a difference between two years passes a significance test.
The survey still documents a meaningful descriptive contrast. In 2025, a smaller share of people reported face-to-face socializing on an average day, and the activity occupied less time across the full population than in 2015. Games and purpose-coded leisure computer use occupied more population-average time.
Those findings are informative without turning them into a story of friends being replaced by screens. They describe what primary activities entered two sets of one-day diaries, under defined BLS categories and with a documented collection gap in 2025. The decade difference is a change in the national pattern the survey recorded—not a diagnosis of why it happened or what it meant for any individual.