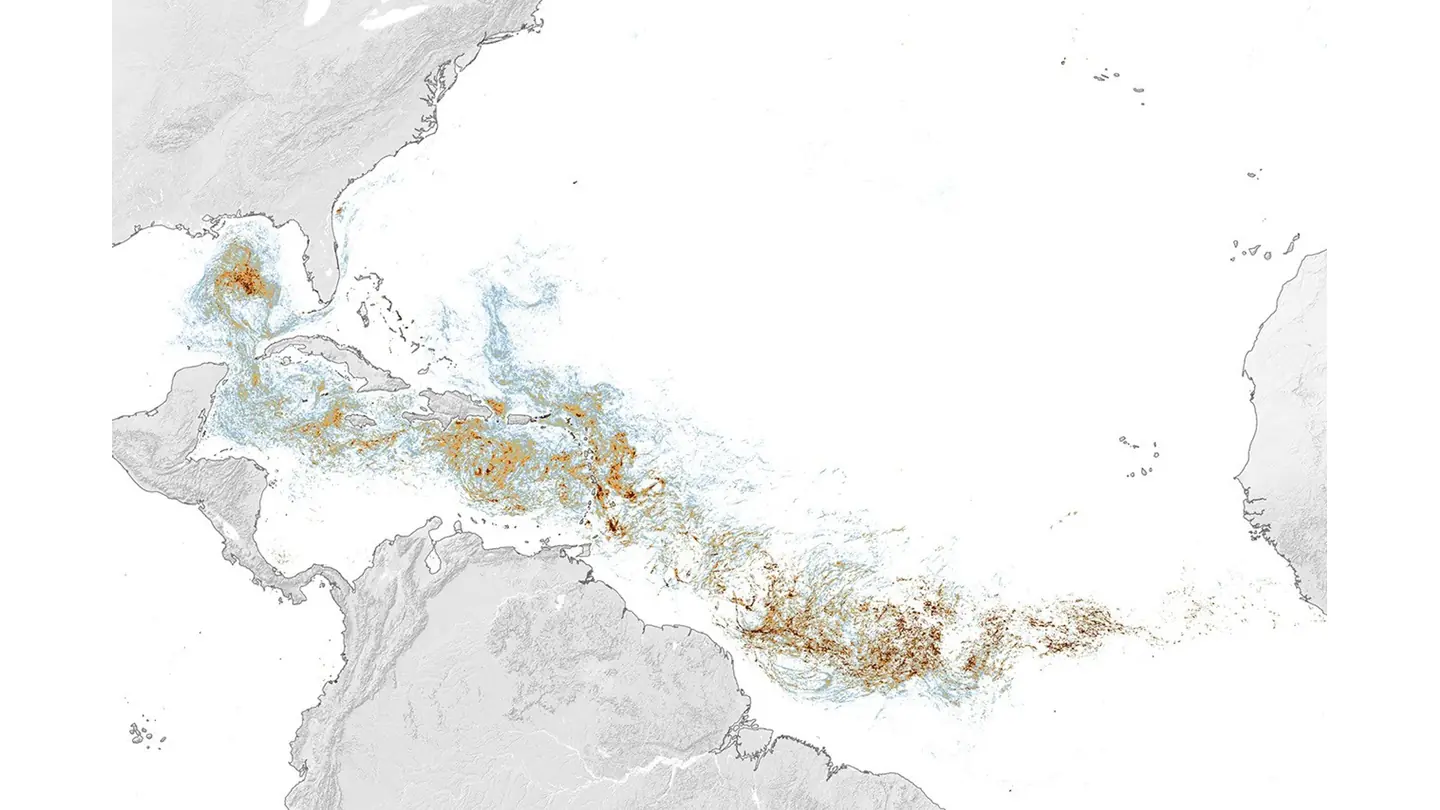
Atlantic Sargassum reached its 2026 seasonal peak in June, when satellites detected extraordinary concentrations across the Caribbean and Gulf of America (Gulf of Mexico). The basin-wide season ranked second in the satellite record, slightly below 2025. Within that larger picture, however, the Caribbean and Gulf set regional records for June.
Those statements describe different geographic scales, not competing versions of the year. They also describe estimates made from light reflected at the ocean surface—not a direct weighing of seaweed, a photograph of one unbroken raft or a forecast of what will arrive on any particular beach.
Reading the maps correctly matters because “belt” is an effective name with a misleading visual implication. Sargassum was distributed across a vast part of the Atlantic in clumps and mats that winds and currents continually rearranged. Even the highest-density class in the University of South Florida’s June map represented 0.4 percent surface coverage. The belt was immense, but it was not solid.
One basin-scale ranking, several regional records
NASA Earth Observatory’s July assessment estimated that the eastern Caribbean held 9 million metric tons of Sargassum at the June peak, while the western Caribbean held 3.6 million metric tons. The Gulf held an estimated 5 million metric tons—nearly twice its previous record, set in 2025.
The University of South Florida’s June 30 bulletin likewise classified Caribbean abundance as record-high for June and reported the 5-million-metric-ton Gulf estimate. Yet it placed the June basin total 10 percent below the 2025 record. A regional maximum can therefore occur during a season that does not set the overall Atlantic record.
The longer satellite series provides another necessary distinction. The MODIS record begins in March 2000. Abundance rose markedly from around 2011, reached its record in July 2025, then climbed rapidly during the first four months of 2026 before peaking in June. NASA said newer observations indicated a decline in July, but those observations were not included in the published chart. They did not yet support a final July amount.
The result is a strong description of the season through its peak, not a claim that 2026 broke the all-time Atlantic record. It did not. Nor do the regional tonnages say that those quantities were moving toward or washing onto Gulf and Caribbean beaches.
How reflected light becomes a biomass estimate
Floating Sargassum differs optically from the water around it. Its chlorophyll and physical structure enhance near-infrared reflectance, giving satellite sensors a signal that algorithms can distinguish from seawater. Researchers use that signal to estimate what fraction of each ocean pixel is covered by Sargassum, then convert surface-cover density into estimated biomass.
NASA’s June map used the Ocean Color Instrument, or OCI, aboard the PACE satellite. It averaged all valid observations for each pixel across the month. That averaging makes a basin-scale pattern legible, but it also compresses a month of movement into one view. Clouds and other data gaps remove some observations, while winds and currents can redistribute patches after a satellite passes overhead.
PACE, launched in February 2024, gives researchers a more detailed spectral view than traditional multiband instruments. OCI samples continuously from 315 to 895 nanometers at fine intervals. In a comparison covering May through August 2024, OCI produced 47 percent more valid pixels than Aqua’s MODIS instrument and detected 51 percent more Sargassum-containing pixels where both instruments had valid observations. OCI and VIIRS detected more Sargassum than MODIS, although all three instruments showed similar broad patterns in space and time.
That improvement is scientifically useful, but it complicates simple year-to-year comparisons. Measurements from OCI, VIIRS and MODIS are not interchangeable: a sensor with greater valid coverage and sensitivity can detect material another sensor misses. The historical series is still valuable, but changes in observation technology must remain part of the interpretation.
A regional view is not a beach forecast
Satellite monitoring connects conditions across the Atlantic with the areas that may need to prepare for Sargassum. It cannot complete the last step from offshore patch to local strandline.
NOAA’s experimental weekly Sargassum Inundation Report identifies patches within 50 kilometers, or about 30 miles, of a coast and assigns a potential risk. NOAA explicitly calls the product an observation, not a forecast. Whether floating Sargassum actually reaches land depends on local currents, tides, winds and waves. NOAA says the timing of beaching cannot currently be predicted.
The distinction resembles the gap between what a satellite can see in a regional wildfire-smoke plume and what people experience at ground level. A wide-area image supplies essential context, but local conditions determine the practical impact. A monthly Sargassum map is even less suited to locating a future arrival because the floating patches remain in motion after they are observed.
Why the Atlantic changed remains unresolved
The rise in Atlantic Sargassum since about 2011 has generated several possible explanations, but the exceptional 2026 abundance cannot be assigned to one established cause. University of South Florida oceanographer Chuanmin Hu has discussed warming, multiple nutrient sources and nitrogen supplied by nitrogen-fixing bacteria as mechanisms under investigation.
Those ideas may describe contributing conditions or interacting processes. They do not establish that climate change, a single nutrient source or any other isolated factor caused the 2026 season. The observations are firmer than the causal account: satellites show where the surface signal appeared, how it changed over time and how estimated abundance compared across regions and years. Explaining the post-2011 regime requires additional evidence about the ocean system that produced it.
The 2026 peak is therefore notable for two reasons. It documents another year near the top of a record that has changed sharply since 2011, and it shows how new instruments can observe Sargassum with broader valid coverage and greater detection sensitivity. At the same time, the limits of that view remain consequential. A denser map is not a solid belt, an estimated tonnage is not a direct weighing, and basin-wide awareness is not a local beach forecast.