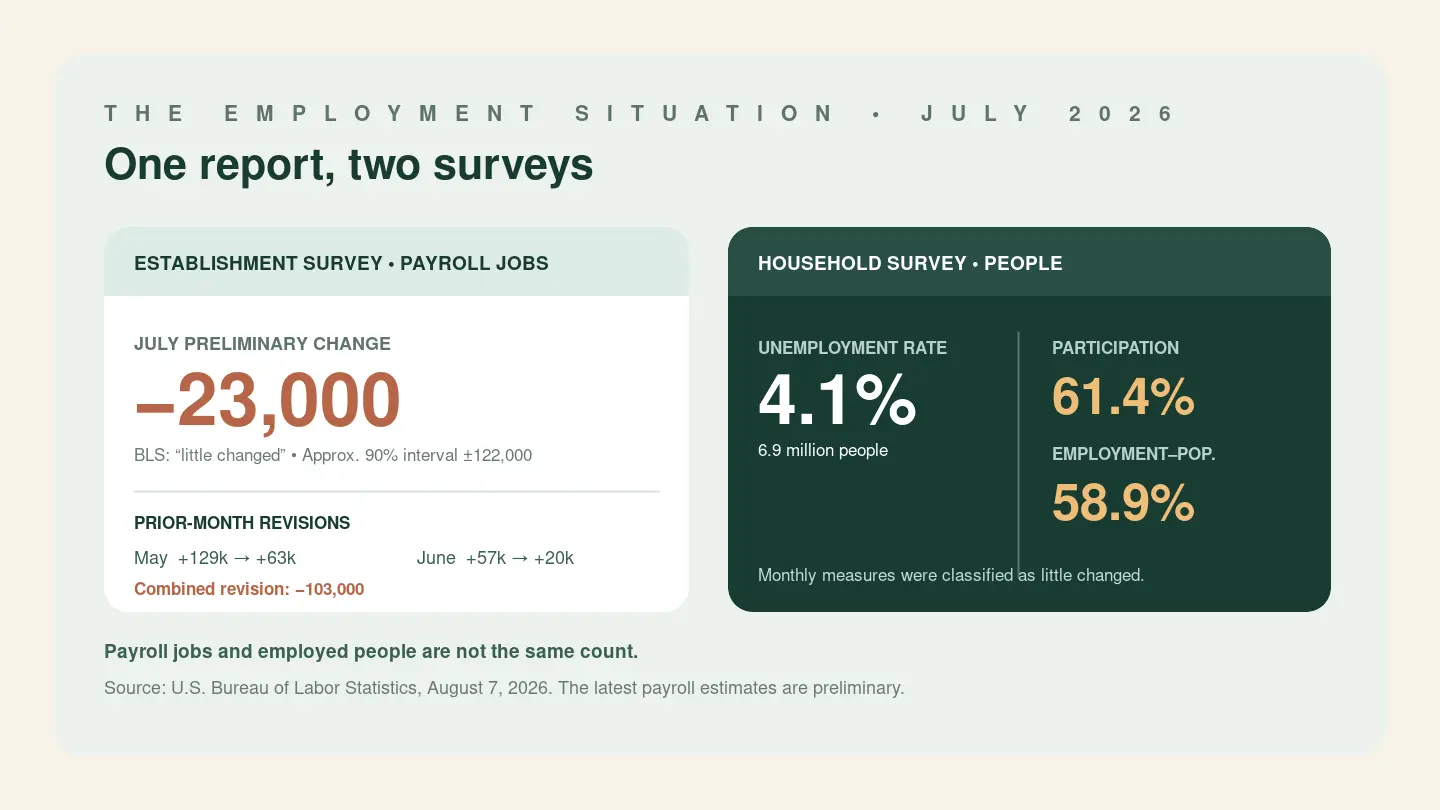
The July jobs report delivered a negative payroll estimate, a slightly lower unemployment rate and large downward revisions to the two preceding months. Those numbers can look contradictory. They are better read as different views of a labor market that showed little movement in July and more convincing signs of softness over a longer stretch.
The Bureau of Labor Statistics report, released August 7, estimated that nonfarm payroll employment fell by 23,000 in July. It put the unemployment rate at 4.1%, representing 6.9 million people. BLS described both payroll employment and unemployment as “little changed.”
That wording is important. The payroll number is an estimate from a large survey, not a precise count of every job in the country. The unemployment rate comes from a separate survey of households. Neither measure, on its own, establishes that the economy has entered a recession, remained safely out of one or moved decisively in either direction.
What the release does show is a weak month for estimated payroll growth, a slower recent payroll-growth pattern after revisions, and household measures that were broadly stable in July but lower than they had been in January.
One report, two surveys
The monthly Employment Situation combines results from two surveys that answer different questions.
The Current Employment Statistics survey, or CES, asks employers about jobs on their payrolls. For this release, it sampled about 119,000 employers representing roughly 622,000 worksites and 26% of nonfarm payroll jobs. Its July estimate of a 23,000 decline refers to payroll positions, not to a head count of employed people.
The Current Population Survey, or CPS, samples about 60,000 eligible households. It covers people age 16 and older in the civilian noninstitutional population and supplies the unemployment rate, labor-force participation rate and employment-population ratio.
The coverage differs as well. The household survey includes agricultural workers, unincorporated self-employed people, unpaid family workers and private household workers, groups excluded from the payroll survey. A person holding two payroll jobs may be counted twice in CES but only once as an employed person in CPS.
These differences are why the payroll estimate and the unemployment rate should not be forced into a one-for-one reconciliation. A month can show a negative payroll estimate while the unemployment rate changes little without either survey necessarily being wrong. They measure different populations with different methods and sampling error.
The payroll estimate was weak, but not exact
The establishment survey estimated that nonfarm payroll employment fell by 23,000 in July. That compares with average monthly growth of 34,000 over the preceding 12 months. In other words, even before deciding how much weight to place on a single estimate, July was weak relative to an already modest recent pace.
Industry estimates were uneven. Local government education fell by 50,000, retail trade by 19,000, and financial activities by 14,000. Health care added 22,000. These industry figures help show where the estimated changes occurred, but they should not be added into a simple story about the entire economy; movements elsewhere also contribute to the total.
The BLS technical note gives an approximate 90% confidence interval of plus or minus 122,000 for a one-month change in total nonfarm employment. July’s estimated decline is far inside that range.
That does not make the payroll survey useless. It means the precise sign and size of a small monthly movement are uncertain. The estimate is consistent with BLS’s description of employment as little changed, and it should not be rewritten as a definitive statement that the United States lost exactly 23,000 jobs.
The longer context is more informative than the sign of one monthly estimate. July’s number sits alongside low average growth over the previous year and substantial revisions to May and June. Together, those readings point to a labor market with limited momentum, even though the release cannot identify a sharp turning point.
Revisions made the recent picture weaker
The revisions were among the report’s most consequential details. May payroll growth was reduced from an initially reported 129,000 to 63,000. June was revised from 57,000 to 20,000. Combined, the two months contained 103,000 fewer jobs than previously estimated.
Those changes matter because monthly labor-market narratives often depend on the latest few observations. With the revisions, the path into July was noticeably softer than the first estimates had suggested.
But a downward revision is not evidence that the numbers were fabricated or politically altered. The two most recent payroll estimates are preliminary. BLS routinely revises them as more employers submit reports and as seasonal factors are recalculated. The revision process is part of the survey’s published method, not an exception created for this report.
The practical lesson is to treat the latest number as provisional. A first estimate can change enough to alter the apparent pace of net job growth, especially when the initial movement is small.
Unemployment changed little; participation has a longer decline
The household survey placed the unemployment rate at 4.1% in July, down from 4.2% in June. The number of unemployed people was 6.9 million. BLS classified both measures as little changed.
A one-tenth percentage-point move can attract attention, particularly when it goes in the opposite direction from the payroll estimate. Here, the agency’s own assessment cautions against calling it a meaningful improvement. Sampling variation and rounding matter, and the rate remained close to its prior level.
Other household measures broaden the picture. The labor-force participation rate was 61.4%, and the employment-population ratio was 58.9%. Both changed little in July. Since January, however, participation had fallen by 0.7 percentage point and the employment-population ratio by 0.5 point.
Those declines show that a stable unemployment rate does not capture every change in the labor market. The unemployment rate counts people without a job who are actively looking and available for work. Participation describes the share of the population working or looking for work, while the employment-population ratio describes the share that is employed.
When participation falls, the unemployment rate can remain steady even as a smaller portion of the population is engaged in the labor force. That does not supply a cause. The July release cannot determine whether the change reflects demographics, immigration policy, interest rates, family decisions, discouragement or any other single force. It records the movement; explaining it requires separate evidence.
Preliminary now, with more revisions ahead
July’s payroll estimate and the latest preceding month remain subject to the normal revision cycle. BLS was also scheduled to publish a preliminary annual benchmark revision on August 28, 2026.
That benchmark preview is another reason to distinguish an estimate about the underlying series from an immediate replacement of the published monthly data. The preliminary benchmark would not itself revise the official series. The final benchmark was planned for incorporation with the January 2027 employment report, scheduled for release in February 2027.
The distinction may sound procedural, but it prevents a common error: treating every announced revision estimate as though it had already changed the official historical record. Until the benchmark is incorporated, the published series and its regular monthly revisions remain the operative figures.
Softness is clearer than a dramatic break
The most defensible reading of July is neither collapse nor resilience. Payroll employment was estimated to have edged down, but by much less than the survey’s uncertainty around a monthly change. Unemployment moved by one-tenth of a point and was classified as little changed. Participation and employment relative to the population were stable over the month but had weakened since January.
The downward revisions give the report more weight than the July payroll number alone. They show that net job growth in May and June was lower than initially estimated and reinforce the picture of a labor market with little recent growth. Even so, revisions are routine, the newest estimates remain preliminary, and no single release diagnoses the economy.
The report’s value lies in those boundaries. It provides evidence of softness while showing why apparent precision can mislead. The payroll survey counts jobs; the household survey describes people. Monthly changes carry sampling uncertainty. Early estimates change as more information arrives.
Taken together, July’s figures suggest a labor market losing momentum without demonstrating a sudden break. Whether that softness becomes a sustained contraction, stabilizes or reverses will be visible only through later revisions and a wider run of economic data.