American businesses produced more output per hour in the second quarter of 2026, even as workers’ inflation-adjusted hourly compensation declined and labor’s share of output reached the lowest level in a series dating to 1947.
Those results appear together in the Bureau of Labor Statistics’ preliminary productivity release, published August 6. They describe an economy in which productivity improved over the quarter but aggregate compensation did not keep pace with consumer prices or current-dollar output.
They do not show that artificial intelligence caused the productivity gain. They do not mean the typical worker’s wage fell by the headline compensation rate. And the record-low labor share does not, by itself, identify who gained, who lost or why.
Reading the report accurately requires keeping its time periods, definitions and revisions separate. The most prominent productivity figure is an annualized quarterly rate, while other figures compare the latest quarter with a year earlier. Compensation includes considerably more than take-home pay, and labor share is an economy-wide ratio rather than a measure of what a median employee receives.
Two productivity rates, two different clocks
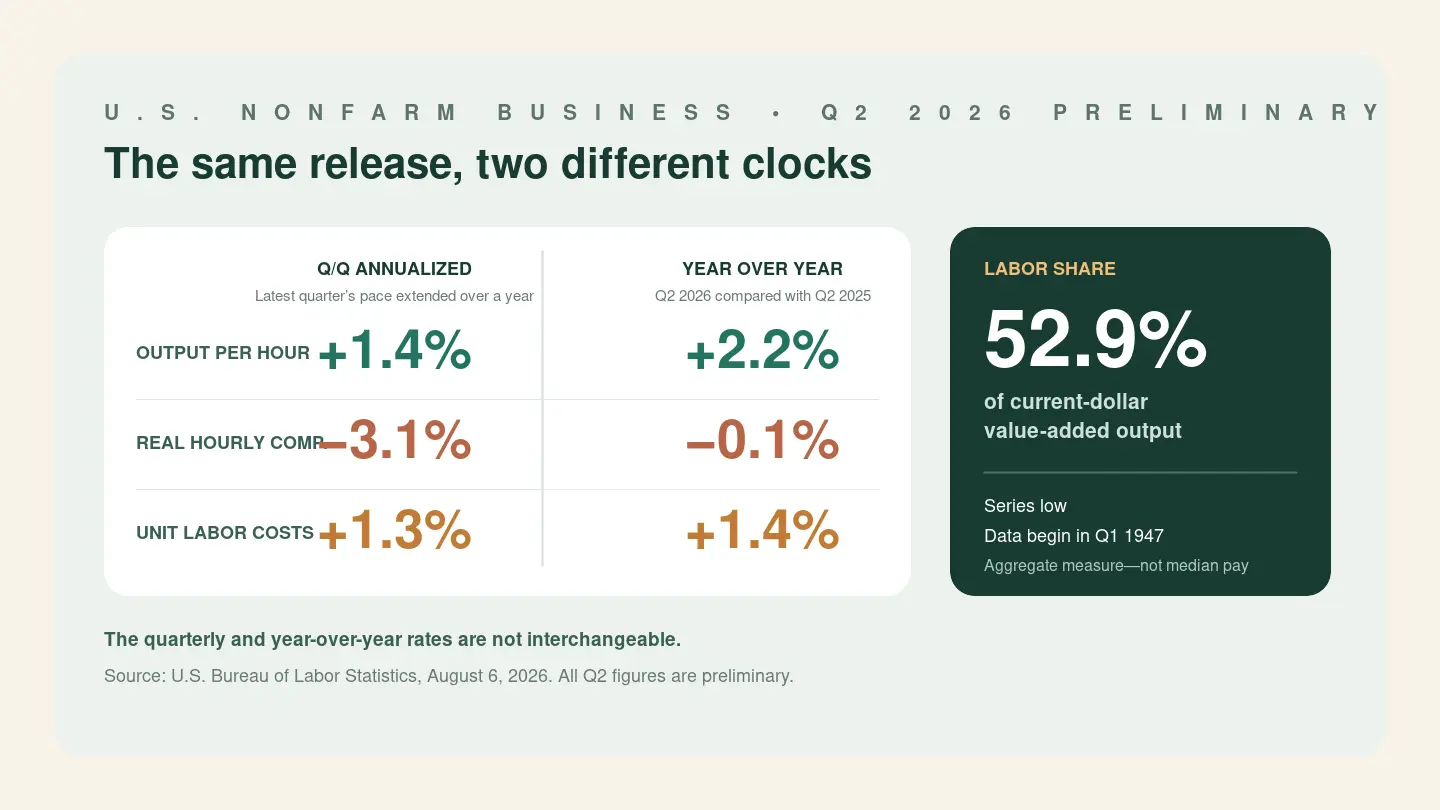
BLS defines labor productivity as real output per hour worked. In the nonfarm-business sector, output rose at a 1.7% seasonally adjusted annual rate from the first quarter to the second, while hours worked rose 0.3%. The combination produced a 1.4% annualized increase in output per hour.
“Annualized” does important work in that sentence. It asks what the full-year change would be if the second quarter’s pace continued for four quarters, with compounding. It does not mean productivity literally increased 1.4% within three months, and it does not predict that the pace will last for a year.
The report’s other major productivity comparison uses a different clock. Relative to the second quarter of 2025, nonfarm-business productivity was 2.2% higher. Over that four-quarter span, output rose 2.5% and hours worked rose 0.2%. This year-over-year comparison is not an annualized version of a single quarter.
The 1.4% and 2.2% figures therefore do not conflict. One extends the latest quarter’s rate hypothetically over a year; the other compares two observed quarterly levels one year apart. Calling either number simply “annual productivity growth” would blur that distinction.
The nonfarm-business sector is broad but not identical to the entire economy. Its output represented about 76% of nominal gross domestic product in 2025. The hours measure includes work by employees, self-employed proprietors and unpaid family workers, while output measures real value added within the sector.
Compensation rose before inflation, then fell after it
Nominal hourly compensation increased at a 2.7% annualized rate during the second quarter and was 3.7% higher than a year earlier. After adjustment for consumer prices, however, real hourly compensation fell at a 3.1% annualized rate over the quarter and 0.1% over the year.
The divergence is straightforward: compensation measured in current dollars rose, but not fast enough to overcome the price adjustment used for the real series during the relevant period. For recent quarters, BLS uses the Consumer Price Index for All Urban Consumers, or CPI-U, to deflate hourly compensation.
The statistic is not the same as the wage shown on a typical employee’s paycheck. Hourly compensation includes wages and salaries, nonwage benefits, employer contributions to social insurance and an estimate of compensation for proprietors. It is an aggregate divided by aggregate hours.
That makes it useful for comparing labor costs and output across the business sector. It does not reveal the experience of the median worker, differences across industries, or how gains and losses were distributed across the workforce. “Real hourly compensation fell 3.1% annualized” is supported by the report; “workers’ wages fell 3.1%” is not.
Unit labor costs link compensation to productivity
Unit labor costs rose at a 1.3% annualized rate in the second quarter and 1.4% compared with a year earlier. BLS defines the measure as hourly compensation divided by labor productivity.
The ratio answers a production question: how much labor compensation is associated with each unit of real output? If compensation per hour rises faster than output per hour, unit labor costs increase. If productivity outpaces compensation, they can slow or fall.
Unit labor costs are therefore not a measure of a household’s cost of living. “Labor cost” in this context refers to compensation used to produce output, not the prices workers pay for housing, food or other goods and services.
The second-quarter figures fit together arithmetically: nominal compensation per hour increased, productivity also increased, and unit labor costs rose more slowly than compensation. That relationship describes the components of the BLS measure. It does not explain the economic forces behind them.
What a 52.9% labor share measures
Labor’s share of nonfarm-business output fell to 52.9% in the second quarter, the lowest reading in the series beginning in the first quarter of 1947. This figure compares aggregate labor compensation with current-dollar value-added output.
It is not the percentage of company revenue that reaches a median worker. Revenue is not the denominator; value-added output is. And aggregate labor compensation includes the broader categories of pay and benefits used elsewhere in the productivity accounts.
The statistic also says nothing directly about how compensation is divided among workers. The same labor share could coexist with very different distributions by occupation, wage level, industry or employment status. A record low is an important distributional feature of the aggregate accounts, but it does not independently prove a change in worker bargaining power, inequality at the employee level, corporate pricing behavior or any particular policy effect.
Productivity is an outcome, not a diagnosis
Rising output per hour can come from many sources. Businesses may install better equipment, reorganize production, use materials more effectively, change staffing, operate existing capacity more intensively or adopt new technologies. Worker skills and management decisions can also matter.
That list includes pathways through which AI could eventually affect output, but the second-quarter release does not separate their contributions. It measures the combined result. Attributing the 1.4% annualized gain to AI would require evidence beyond the aggregate productivity accounts.
Short-run productivity can also be volatile. Output and hours do not always adjust at the same speed when demand changes. A quarterly annualized rate magnifies the latest three-month movement into a hypothetical full-year pace, making clear labels and longer comparisons especially important.
Manufacturing figures in the release should not be substituted for the nonfarm-business measures, either. BLS uses different output concepts for manufacturing, so the sector’s productivity estimates are not directly comparable with the broader nonfarm-business series.
Preliminary numbers can move
BLS scheduled a revised second-quarter release for September 3, 2026. Recent history within the same report shows why that matters: the agency revised first-quarter nonfarm-business productivity from a 0.3% annualized increase to 0.8%, while unit labor costs were revised from 1.8% to 1.3%.
Over a longer period, revisions have often been large enough to change the emphasis placed on a quarter. For quarters from the beginning of 2001 through the end of 2025, the third productivity estimate differed from the first by between −1.1 and +1.4 percentage points about 80% of the time.
That range does not predict how the second-quarter estimate will change. It shows why a preliminary decimal should not be treated as permanent. Later source data can alter output, hours and compensation, which flow through to productivity, unit labor costs and labor share.
The current picture is nonetheless coherent: output per hour increased by both the quarterly annualized and year-over-year measures; aggregate real hourly compensation declined slightly over the year and more sharply at the second quarter’s annualized pace; unit labor costs continued to rise; and labor’s aggregate share of output reached a series low.
The tension among those measures deserves attention precisely because no single statistic translates directly into the experience of a typical worker. The release provides an early accounting of production and compensation in the business sector. Explaining what caused that pattern—and how its benefits and costs were distributed—requires evidence the productivity tables were not designed to supply.