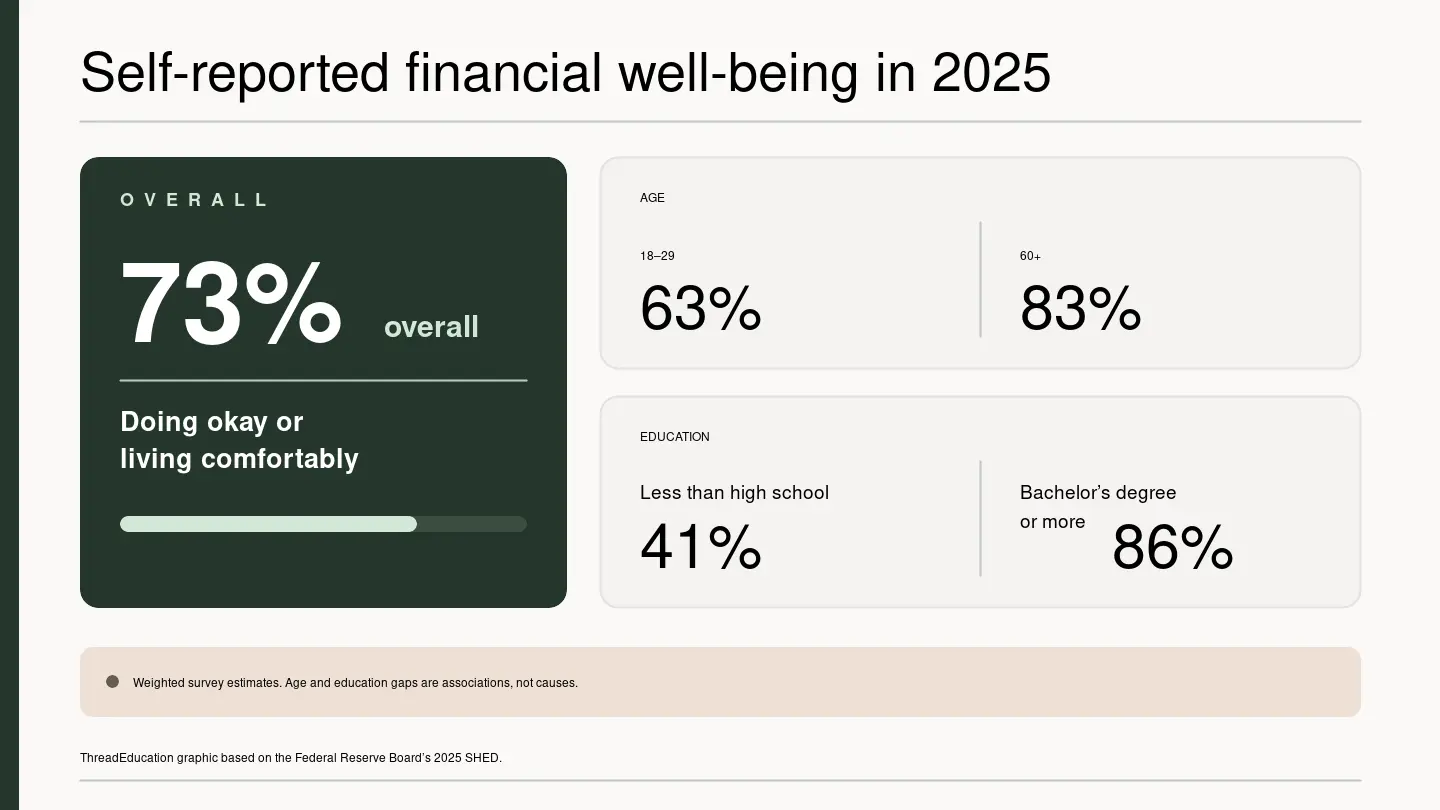
In October 2025, 73 percent of U.S. adults said they were either doing okay financially or living comfortably. That was the same share as in 2024 and close to where the measure had stood since 2022, according to the Federal Reserve Board’s latest Survey of Household Economics and Decisionmaking.
The stability is real within the terms of the survey, but it is not the whole story. The headline combines people with very different assessments of their finances, and the national average sits over large gaps by age and education. At the same time, a greater share of respondents expressed concern about finding or keeping a job than a year earlier.
None of those answers is an administrative measure of income, wealth, employment or ability to pay. They describe what adults reported about their own circumstances at the time of the survey. Read that way, the results show an overall measure that barely moved while the experience underneath it remained sharply uneven.
What the stable 73 percent contains
The combined figure is built from two responses: 39 percent of adults said they were doing okay financially, while 34 percent said they were living comfortably. Another 19 percent said they were just getting by, and 8 percent said they were finding it difficult to get by.
The 73 percent result was unchanged from 2024 and near its level in every year since 2022. It nevertheless remained below the survey’s recent high of 78 percent in 2021. This is best understood as stability in a self-assessment, not proof that nearly three-quarters of adults were objectively financially secure or free from hardship.
The survey’s widely cited emergency-expense question offers a different view of financial resilience, but it also requires an exact definition. Sixty-three percent said they would cover a hypothetical $400 emergency expense entirely with cash, savings, or a credit card paid off at the next statement. That share was unchanged from the previous three years.
It does not mean that 63 percent had at least $400 sitting in a savings account. The definition includes the specified credit-card payment method. Nor does the remaining 37 percent represent adults who could not afford the expense: some respondents selected borrowing or selling something as ways to pay. Twelve percent said they could not pay the expense by any means.
Together, the two measures show why a single percentage cannot summarize household finances. One asks people to characterize their overall financial position. The other asks how they would handle a specific hypothetical bill using defined payment methods. Neither is a balance-sheet inspection.
Age and education divide the national average
Self-reported financial well-being varied substantially with educational attainment. Among adults with at least a bachelor’s degree, 86 percent said they were doing okay or living comfortably. Among adults without a high-school degree, the share was 41 percent.
The report described the annual decline for adults without a high-school degree as sharp. For the other three education groups it displayed, the changes from 2024 were explicitly not statistically significant. The cross-sectional gap is clear, but the survey cannot show that education by itself caused the difference. Educational attainment is connected with many other characteristics and opportunities that the comparison does not hold constant.
The age pattern was also wide. Sixty-three percent of adults ages 18–29 reported doing okay or living comfortably, compared with 83 percent of adults age 60 or older. The Federal Reserve report said the age gap widened mainly because well-being declined among adults ages 18–24.
The report suggested that this pattern may reflect a more difficult job market for younger adults. That is an interpretation, not a causal finding. The survey did not randomly assign labor-market conditions, and its age groups also differ in earnings histories, household structures and other ways that can shape how people assess their finances.
Job concern rose, especially among younger and lower-income adults
Forty-two percent of adults called finding or keeping a job either a minor or major concern, up from 37 percent in 2024. The report does not publish a significance test alongside that particular increase, so the five-point difference should not be described as statistically significant based on its size alone.
The distribution of major concern was much less even than the overall number. It was reported by 31 percent of adults ages 18–29, compared with 14 percent of adults age 30 or older. Major concern was also reported by 30 percent of adults with family income below $50,000 and 11 percent of those with family income of $50,000 or more.
This question was administered to a randomized half-sample rather than every survey respondent. Its answers measure concern, not job loss, unemployment or a recession forecast. They nevertheless add an important dimension to the stable overall well-being result: people can describe their current finances the same way as a year earlier while feeling less certain about their ability to find or retain work.
A weighted national snapshot with important limits
Ipsos fielded the online survey from October 17 through October 28, 2025, using its probability-based, address-recruited KnowledgePanel. The final analytic sample included 12,934 U.S. adults age 18 or older. Of 17,899 invited panelists, 13,099 completed the survey, but the cumulative response rate across the stages of panel recruitment and the survey itself was 4.1 percent. The responses were then weighted to represent roughly 265 million noninstitutionalized civilian adults. Post-stratification accounted for age, gender, race, ethnicity, region, metropolitan status, education and income; the reported design effect was 1.14. Those adjustments are central to making national estimates, but they do not eliminate every source of coverage or nonresponse error.
People living in institutions and members of the military were outside the target population. Address-based sampling is also likely to miss people experiencing homelessness. Although panelists who needed them were supplied with internet access and devices, the survey was conducted online in English, which may underrepresent people who do not speak English.
About one-third of respondents had also answered the survey in 2024, but the headline year-to-year estimates are weighted cross-sectional comparisons, not a study following a fixed cohort. And although the report is labeled 2025, the answers reflect circumstances in October or, for some questions, experiences over the prior 12 months—not necessarily the calendar year as a whole.
That context does not erase the stability in the 73 percent figure. It defines what the number can support. In the Federal Reserve’s survey, the average self-assessment held steady, emergency-expense payment plans were unchanged, and reported job concern was higher. Beneath those national estimates, younger adults and people with less education reported markedly different financial positions. The result is not a declaration of broad financial security or a diagnosis of what caused the gaps. It is a snapshot in which a stable headline and uneven household realities coexist.