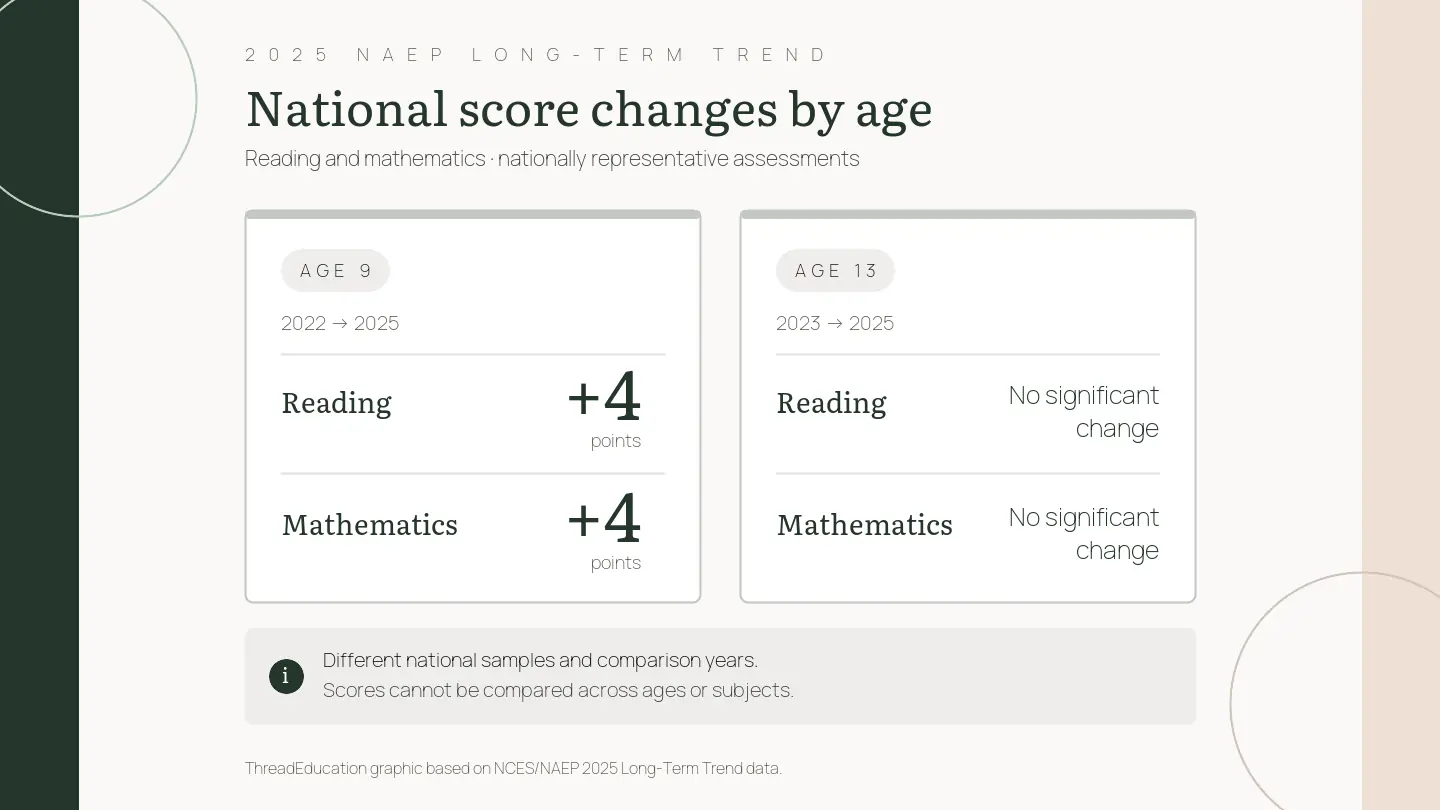
Nine-year-olds in the United States scored higher in reading and mathematics in 2025 than children of the same age did in 2022. The gains were concentrated in an especially important part of the distribution: lower-performing students at the 10th and 25th percentiles improved in both subjects, while mathematics also improved at the 50th percentile.
That is evidence of progress, but not of a general academic recovery. Reading for 9-year-olds was not significantly different from 2020, while mathematics remained below its 2020 score. Among 13-year-olds, neither reading nor mathematics changed significantly from 2023, and both remained significantly below 2020.
The results come from the National Assessment of Educational Progress Long-Term Trend assessment, or LTT. It was designed to track national performance within age groups over time. It does not follow individual children, identify why scores changed or translate point differences into a number of months or years of learning.
The clearest improvement was among 9-year-olds
NCES reported a 4-point gain from 2022 to 2025 for 9-year-olds in both reading and mathematics. Scores also rose at the 10th and 25th percentiles in each subject, while mathematics also rose at the 50th percentile. The 75th and 90th percentiles did not change significantly. Reading gains were therefore concentrated among lower performers, while mathematics gains reached lower and middle performers rather than appearing only in the average.
The published tables require careful reading. Rounded reading scores were 218 in 2025 and 215 in 2022, which looks like a 3-point difference. NCES reports a 4-point gain because its comparisons use unrounded estimates. Mathematics rose from a rounded 234 to 238.
NCES tests differences using unrounded estimates and their standard errors, with a significance threshold of p less than .05 and adjustments for multiple comparisons. A visible gap between two rounded numbers is therefore not automatically meaningful, and scores that look equal after rounding can still differ statistically.
The longer comparison tempers the encouraging short-term result. The 2025 reading score for 9-year-olds was not significantly different from the 2020 score. Mathematics remained 4 points lower than in 2020. The evidence supports a gain since 2022, especially among lower performers; it does not show that both subjects have returned to their earlier position.
Thirteen-year-olds remained on a different path
For 13-year-olds, the latest comparison begins from 2023 rather than 2022. Rounded reading scores were 256 in both 2023 and 2025. Mathematics moved from 271 to 270. Neither change was statistically significant, so the result is stability at the national average—not a demonstrated new decline and not a rebound.
Compared with 2020, however, both 2025 scores were significantly lower. Reading was 256 rather than 260, and mathematics was 270 rather than 280. Those subject-specific comparisons show the distance from the earlier result. They should not be converted into a common amount of instructional time or used to compare the absolute level of reading with mathematics, because the subjects have independently developed 0-to-500 scales.
The age groups also should not be arranged into a story in which the 9-year-olds of 2022 became the 13-year-olds of 2025. LTT draws new, cross-sectional samples for each administration. The groups were assessed in different seasons of the 2024–25 school year and compared with different earlier years: 13-year-olds tested from October through December, while 9-year-olds tested from January through March.
The contrast between the ages is still informative. It shows that the national trend is not moving uniformly across students. But the strongest claim the assessment supports is two separate within-age findings: gains for 9-year-olds since 2022 and no significant average change for 13-year-olds since 2023.
What LTT measures—and what it does not
The 2025 LTT used nationally representative samples from public and private schools and paper assessments. About 7,400 9-year-olds took reading and 7,600 took mathematics. At age 13, about 8,200 students took each subject. No student took both reading and mathematics; each assessment consisted of three 15-minute blocks.
Those design choices make LTT useful for tracking national performance at a given age over long periods. They also separate it from Main NAEP, the results more often described as the Nation’s Report Card for grades 4 and 8. Main NAEP samples by grade, uses different questions and difficulty, and supports different reporting levels. NCES says their scores and achievement levels cannot be compared directly. The 2025 LTT results therefore cannot be treated as a direct reversal or confirmation of the 2024 Main NAEP results; they answer a different measurement question.
LTT is also observational. It records differences across nationally representative samples, not the effect of a controlled intervention. The assessment cannot assign the 9-year-old gains to tutoring, attendance, curriculum, policy or any other proposed explanation. It likewise cannot identify one cause for the lower scores relative to 2020.
Participation and scoring add necessary context
Before substitute schools were included, weighted national school participation was 89 percent at age 9 and 85 percent at age 13. Student participation was 91 percent and 89 percent, respectively. Private-school participation was much lower—37 percent at age 9 and 35 percent at age 13—and fell below the 70 percent threshold required for NCES to report separate private-school results.
NCES also documented a scoring problem and its response. Some marks such as checks, Xs or circled ovals were initially machine-scored as missing answers. When more than 10 percent of the multiple-choice responses in a booklet appeared to be missing, a human coder reviewed the booklet and inferred the student’s intended answers. Scores incorporating those recovered responses became the official 2025 results.
The NCES response-recovery summary reports that human review recaptured 4 percent of the answers examined in both subjects at age 9, compared with 13 percent in mathematics and 17 percent in reading at age 13. Average-score estimates, both overall and for individual student groups, did not differ significantly before and after the additional scoring. That does not prove a zero numerical effect, and it would still be unwarranted to claim that the recovery step either created the trend or repaired a measurable bias.
The 2025 results are best understood as uneven movement rather than a single verdict on American education. Nine-year-olds improved from a low 2022 comparison point, with welcome gains among lower performers. Their mathematics score still trailed 2020. Thirteen-year-olds did not change significantly from 2023 and remained below 2020 in both subjects. “Recovery” describes part of that picture, but only when the age, subject, performance level and comparison year remain attached.